Saturday, July 21, 2007
The Human Geometry
The Human Geometry Project celebrates mathematical art, music, dance and literature through exploration of the human form. And for more risqué pictures, visit Naked Geometry.
Thursday, July 19, 2007
Mapping A Medusa: The Internet Spreads Its Tentacles

CHARTING A COURSE. A new map of the Internet shows a core containing the most tightly connected subnetworks (red), while the least-connected subnetworks lie at the edge (purple).
After enlisting the help of thousands of volunteers to track how digital information weaves around the world, researchers can offer a new simile: The Internet is like a medusa jellyfish. It has a dense core surrounded by a highly connected body, from which tentacles dangle.
Click here for more information.
Friday, July 13, 2007
Gato (Graph Animation Toolbox)

Gato - the Graph Animation Toolbox - is a software which visualizes algorithms on graphs. Graphs are mathematical objects consisting of vertices and edges connecting pairs of vertices: think of cities as vertices and interstates as edges connecting two cities. Algorithms might find a shortest path - the fastest route - or a minimal spanning tree or solve one of other interesting problems on graphs: maximal-flow, weighted and non-weighted matching and min-cost flow. Visualisation means linking cause - the statements of an algorithm - immediately to an effect - changes to the graph the algorithm has as its input - by terms of blinking, changing colors and other visual effects.
Galaxy Zoo
Welcome to GalaxyZoo, the project which harnesses the power of the internet - and your brain - to classify a million galaxies. By taking part, you'll not only be contributing to scientific research, but you'll view parts of the Universe that literally no-one has ever seen before and get a sense of the glorious diversity of galaxies that pepper the sky.
Wednesday, July 11, 2007
Minimal Primes
Jeffrey Shallit wrote a very interesting paper on minimal primes. The PostScript file can be downloaded here.
To print, you can use the free Windows printing utility PrintFile.
To print, you can use the free Windows printing utility PrintFile.
Tuesday, July 10, 2007
ZipCode Census Dashboard
The ZipCode Census Dashboard is a flash application that displays U.S. census statistics.
Monday, July 09, 2007
NASA MathTrax
MathTrax is a graphing tool for middle school and high school students to graph equations, physics simulations or plot data files. The graphs have descriptions and sound so you can hear and read about the graph. Blind and low vision users can access visual math data and graph or experiment with equations and datasets.
Tuesday, July 03, 2007
Mathematical Visualization Toolkit
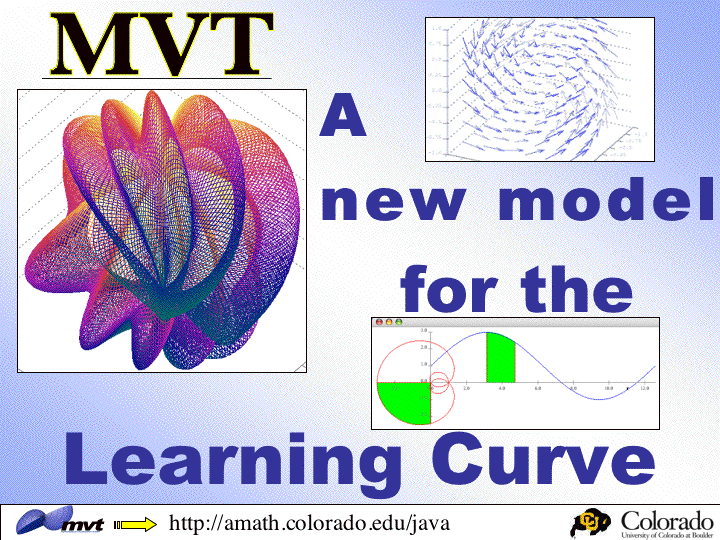
The Department of Applied Mathematics in the University of Colorado at Boulder provides an interesting Mathematical Visualization Toolkit for visual learning of Calculus and Differential Equations by students.
Subscribe to:
Posts (Atom)
