Experience Geometry on your desktop and on the web. Easily create startling geometric constructions! Starting from simple triangle relations, continuing with trigonometric theorems up to fractals and transformation groups Cinderella lets you create and manipulate visualizations in an intuitive, yet powerful way.
Click here for more information.
Showing posts with label Java. Show all posts
Showing posts with label Java. Show all posts
Tuesday, December 16, 2008
Monday, February 25, 2008
The Sheet-Based Calculator (Part II)
After finding the Sheet-Based Calculator link and source code, I decided to download it and improve it for my Java learning experience and also because it's neat. :-)
Here's a link to the JAR file if you're interested.
Here's a link to the JAR file if you're interested.
Wednesday, February 20, 2008
The Sheet-Based Calculator
The Sheet-Based Calculator allows you to enter normal mathematical expressions in a word-processor-like environment, but then to execute them as well. Its algorithm is implemented by using compiler concepts and parser grammar rules. It can be used in most operating systems because it is written in Java.
Tuesday, July 03, 2007
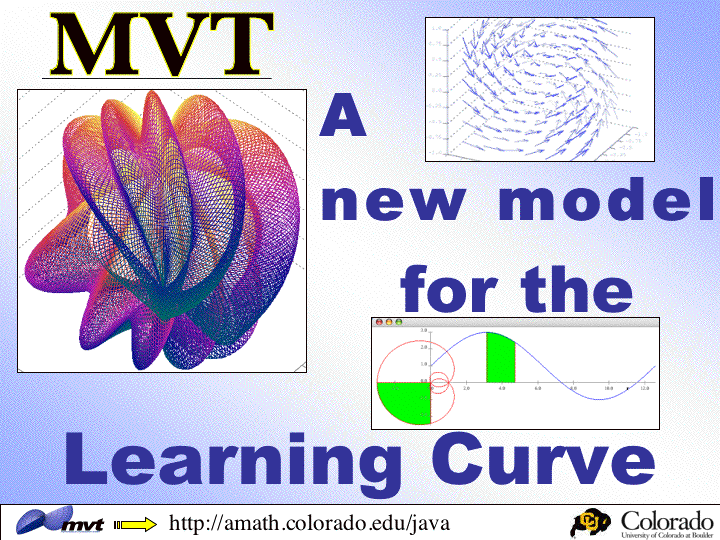
Mathematical Visualization Toolkit

The Department of Applied Mathematics in the University of Colorado at Boulder provides an interesting Mathematical Visualization Toolkit for visual learning of Calculus and Differential Equations by students.
Labels:
calculus,
differential equations,
Java,
software,
visual
Wednesday, May 09, 2007
Factorization Using the Elliptic Curve Method
Click here for a Java implementation of integer factorization using the elliptic curve method (ECM). Source code included.
Friday, April 27, 2007
yEd - Java Graph Editor

yEd is a very powerful graph editor that is written entirely in the Java programming language. It can be used to quickly and effectively generate drawings and to apply automatic layouts to a range of different diagrams and networks.
Wednesday, April 25, 2007
VisualComplexity
VisualComplexity.com is a unified resource space for anyone interested in the visualization of complex networks. They present a large number of network data similar to ManyEyes. An interesting example of visualization can be seen at ZipDecode.
Monday, April 23, 2007
Monday, April 16, 2007
Ulam's Spiral

Ulam's Spiral, also known as the Prime Spiral, is a plot in which the positive integers are arranged in a spiral (left figure), with primes indicated in some way along the spiral. In the right plot above, primes are indicated in red and composites are indicated in yellow.
Le Village Premier has an interesting stand-alone Java application that can generate the spiral.
Thursday, April 12, 2007
Wednesday, April 11, 2007
Subscribe to:
Posts (Atom)
